
Buyer’s Guide to San Francisco Real Estate Micro Markets
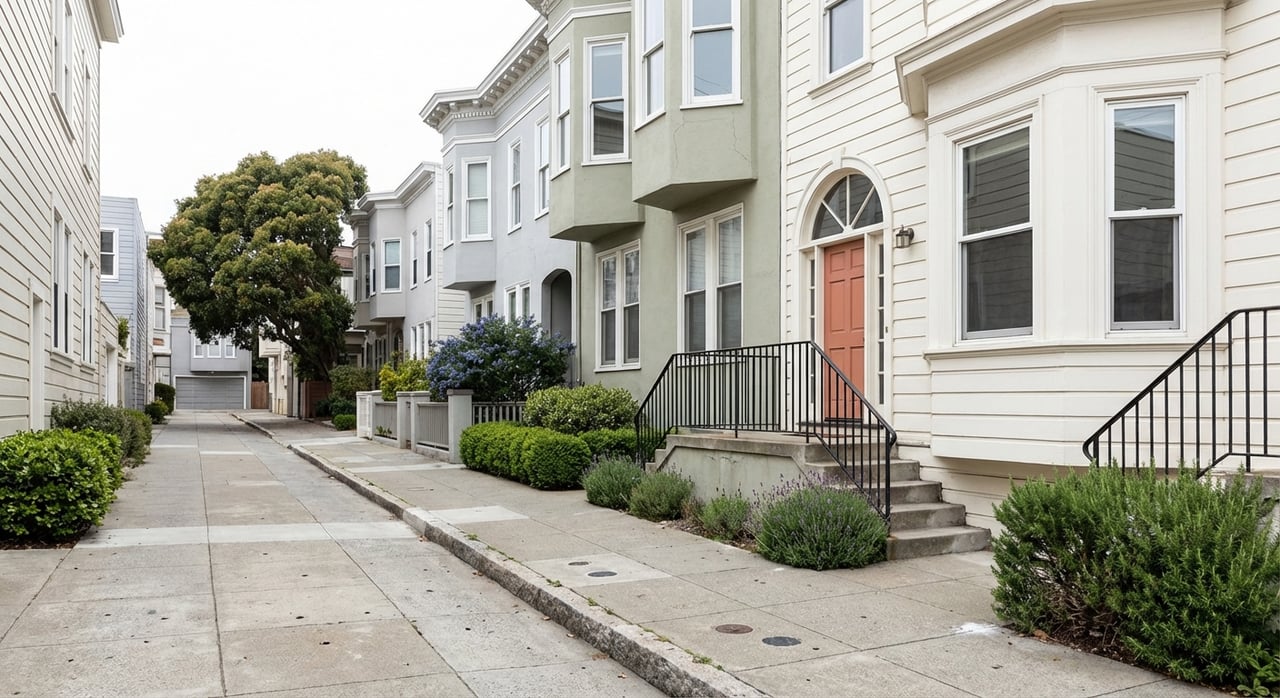
You can cross a single street in San Francisco and move into a different real estate reality. Prices, buyer competition, and even sunlight can change fast from block to block. If you want to buy with confidence, you need a way to compare apples to apples in each micro-market. In this guide, you’ll learn how San Francisco’s micro-markets work and get a simple, repeatable method to evaluate comps, Days on Market, and price per square foot. Let’s dive in.
A micro-market is a small area where homes trade under similar conditions, often just a few blocks wide. In San Francisco, this matters because the city blends dense condo corridors, single-family pockets, and multi-unit blocks in close proximity. The Planning Department’s 2024 Housing Inventory shows a diverse stock of roughly 417,824 units, which sets very different local dynamics by building type and street pattern. You should avoid citywide averages and compare within the same kind of area and home. San Francisco Planning’s Housing Inventory explains why one number rarely fits all.
Local microclimates add another layer. Coastal fog often enters through the Golden Gate and splits around the hills, which is why one neighborhood can be sunny while another is cool and foggy at the same hour. That difference in sun, exposure, and outdoor comfort affects what buyers value and how prices behave. If you are new to this, read the overview of Karl the Fog to see how topography shapes daily conditions. SFGATE’s explainer on Karl the Fog is a helpful primer.
A single citywide price-per-square-foot or median DOM hides big gaps between submarkets. A methodical approach helps you avoid overpaying in one area or missing value in another. Use consistent polygons, match on property type, and apply time adjustments when needed. You will make clearer decisions and write offers with the right level of speed and conviction.
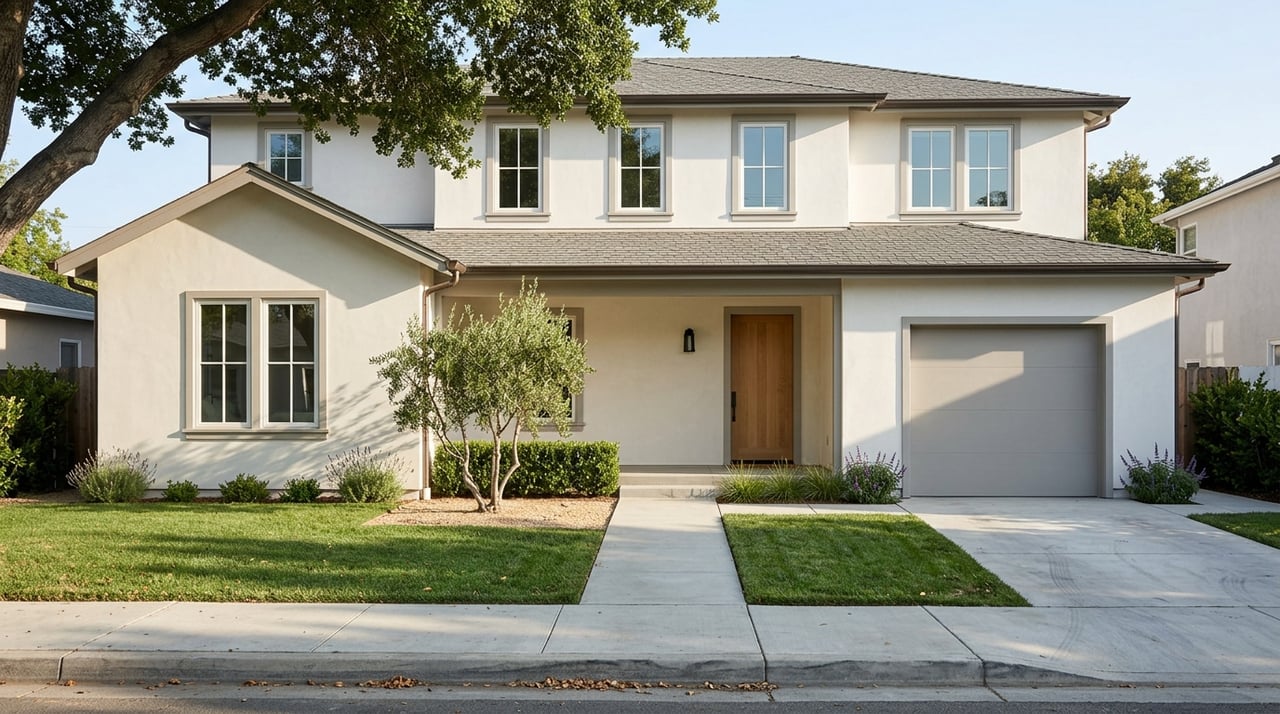
Start by separating single-family homes from condos, TICs, 2–4 unit buildings, and 5+ multifamily. They trade on different drivers and timelines. The city’s mixed stock supports different $/sf and DOM patterns, so compare within the same property type first. See the distribution in the 2024 Housing Inventory.
New construction clusters can shift local comps by adding different product types and changing supply. Before you commit to an area, scan the city’s Housing Dashboard and the Development Pipeline report to see where projects are entitled or under construction. A heavier pipeline nearby can influence pricing and resale timelines.
Sun, wind, and fog are real valuation inputs in San Francisco. Hills can funnel or block the marine layer, creating dramatic differences between neighborhoods like the Mission and the Sunset. If outdoor space and warmth matter to you, factor microclimate into your search. Get a feel for the mechanism in SFGATE’s overview of Karl the Fog.
Investor outcomes and multi-unit pricing are sensitive to local rent rules and permitting. Verify whether a property is subject to rent stabilization or special restrictions through official channels before you rely on pro formas. The Planning Department’s inventory highlights how regulation shapes use and tenure at the city level. See the Housing Inventory for context.
Higher-end micro-markets often include pocket or off-market listings that never hit public portals. That can distort your view of inventory, DOM, and competition if you rely only on MLS-syndicated data. For strategy, understand how private channels work, as covered in the Washington Post’s reporting on pocket listings.
Do not mix condos with single-family homes or 2–4 unit buildings when you compare PSF or DOM. If you need a broader view, present each type separately so conclusions stay clean. The Housing Inventory shows why building type matters.
Use one polygon for solds, pendings, and active listings. Options include an MLS neighborhood, a custom 0.5–1.0 mile radius, or a Planning Department analysis area. Consistency prevents a mismatch between the comps and the property you want. Planning’s geography is documented in the Housing Inventory.
PSF is a helpful screen, but not the finish line. Also consider total sale price, price per bedroom, and like-for-like gross price when views, lots, or parking drive value. Understand PSF’s limits so you do not overfit a single number. See the cautions in RISMedia’s discussion of PSF limitations.
Match on property type, nearby blocks, lot size, gross living area band, parking, bath count, view, and renovation level. Use recent arm’s-length sales first. If you need to reach back in time, apply a supported time adjustment. The Appraisal Institute’s guidance emphasizes picking comps that require minimal adjustments.
For condo-heavy corridors with many sales, a 3–12 month window can work. For thin single-family pockets, use 12–24 months and rely more on physical comparability plus time adjustments. Appraisers make time adjustments when conditions change, as noted by the FHFA.
If a micro-market has 40 active listings and 10 closed sales last month, months of supply is 4. That suggests a more balanced environment. Use these together to gauge leverage, as outlined in Inman’s practical guide to market metrics.
When sales are sparse, stratify PSF by size bands, exclude trophy outliers when estimating typical values, and supplement sold data with confirmed pending or private activity when available through your agent. This keeps your signal from being overwhelmed by one unusual sale.
If the property is highly unique or the stakes are high, consider an appraiser for a documented sales-comparison analysis with time adjustments. See the Appraisal Institute’s notes on methodology.
Noe Valley’s low and medium density stock and family-oriented homes trade differently from SoMa and South Beach’s high-rise condo corridors. Compare single-family homes to similar nearby homes and condos to buildings with like amenity tiers. Do not blend tower PSF with a two-story row house. The city’s mixed stock patterns in the Housing Inventory explain the divergence.
The Inner Sunset sits closer to UCSF and Golden Gate Park, and conditions can differ from the Outer Sunset near the ocean. Microclimate can shape how buyers value yards, exposure, and outdoor living. When screening PSF, flag ocean-facing blocks and distance to Ocean Beach. For weather context, see Karl the Fog’s mechanics.
Bayview and Hunters Point have larger redevelopment potential and greater value dispersion, while Pacific Heights is established with different turnover and pricing patterns. Compare the same product types and adjust for lot and view. Check nearby projects using the Pipeline report to understand future supply.
Buying in San Francisco rewards careful segmentation, clean comps, and on-the-ground insight. Our team brings local market mastery, data-driven analysis, and culturally fluent guidance in English, Mandarin, and Cantonese. If you want a focused search, strong negotiation, and access to private channels backed by Compass resources, connect with the Wang Tang Group. We are ready to help you buy with clarity and confidence.


Jenny and Carmen live with their families in the Peninsula and are trusted by hundreds of clients, having successfully closed countless transactions across San Mateo, San Francisco, Santa Clara, and Alameda counties. From property upgrades, inspections, and strategic marketing to finding the best lenders, they guide clients through every step of the real estate journey.

Wang Tang Group
Address
1440 CHAPIN AVE STE 200
BURLINGAME, CA 94010
Jenny Wang | CA DRE# 02063767
Carmen Tang | CA DRE# 01974969